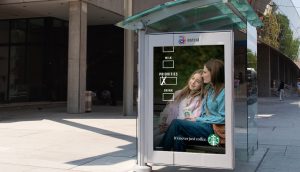
Clothing and footwear manufacturers and retailers had spread their ad budgets pretty evenly across TV, out-of-home and dailies until 2003 when total spending soared about 83% above the previous year. TV accounted for 50% of the spending that year with department store clothing, leisure and loungewear, and jeans contributing to the surge. In 2004, numbers returned to levels consistent with the previous two years and once again TV (31.7%), dailies (27.8%), and OOH (27.5%) received more equal pieces of the pie.
Annual National Advertising Spend – Q1 – Apparel
| Q1 2001 | Q1 2002 | Q1 2003 | Q1 2004 | ||
| Apparel manufacturers & assoc. | $985,855 | 729,845 | 1,230,214 | 743,728 | |
| Children’s wear | $25,822 | 68,548 | 53,772 | 137,335 | |
| Coats & jackets | $117,121 | 77,143 | 97,484 | 180,491 | |
| Dept. stores, clothing | $1,745,960 | 1,490,522 | 4,205,739 | 2,606,883 | |
| Dept. stores, footwear | $470,847 | 146,269 | 13,750 | 5,722 | |
| Jeans | $1,175,802 | 776,713 | 1,583,847 | 855,882 | |
| Leisure & loungewear | $982,553 | 784,839 | 2,624,622 | 903,299 | |
| Menswear | $419,837 | 610,463 | 627,527 | 366,293 | |
| Shoe stores | $2,659,124 | 2,718,976 | 3,175,707 | 2,357,097 | |
| Total | $8,582,921 | $7,403,318 | $13,612,662 | $8,156.730 |
National Q1 Total Spend by Medium
2001
| Dailies | $1,965,803 | (22.9%) |
| Magazines: | $732,463 | (8.5%) |
| Out of Home: | $2,813,768 | (32.8%) |
| Radio: | $165,320 | (1.9%) |
| Total TV: | $2,905,567 | (33.9%) |
2002
| Dailies | $1,935,678 | (26.1%) |
| Magazines: | $933,691 | (12.6%) |
| Out of Home: | $2,185,433 | (29.5%) |
| Radio: | $83,405 | (1.1%) |
| Total TV: | $2,265,111 | (30.6%) |
2003
| Dailies | $2,683,367 | (19.7%) |
| Magazines: | $1,273,074 | (9.4%) |
| Out of Home: | $2,603,068 | (19.1%) |
| Radio: | $181,357 | (1.3%) |
| Total TV: | $6,871,796 | (50.5%) |
2004
| Dailies | $2,266,616 | (27.8%) |
| Magazines: | $966,153 | (11.8%) |
| Out of Home: | $2,244,264 | (27.5%) |
| Radio: | $93,329 | (1.1%) |
| Total TV: | $2,586,368 | (31.7%) |
National Q1 2004 – Top 5 Spenders, Apparel
1) Hudson’s Bay Company
2) Payless Shoesource Inc.
3) Santana Inc. (Jeans)
4) Wal-Mart Stores Inc.
5) Esprit de Corp Ltd. (manufacturers & assoc.)
The preceding data is from the Nielsen Media Research, AdExpenditures. For more information, please contact Andrea Beach, business manager, andrea.beach@nielsenmedia.com.
All data courtesy of Nielsen Media Research.


